The Guard Analytics section in the Back Office Dashboard provides valuable insights into guard performance, activity, and overall productivity. It helps administrators and managers monitor guards’ attendance, site coverage, tour performance, and other key operational metrics — all in one place.
This article will guide you through the steps to access and view guard analytics on the Back Office Dashboard, so you can make informed decisions and effectively manage your security operations.
✅ Step-by-step guide to view guard analytics on the Back-Office Dashboard.
To access guard analytics, go to Analytics from the main menu and select Security Guard.
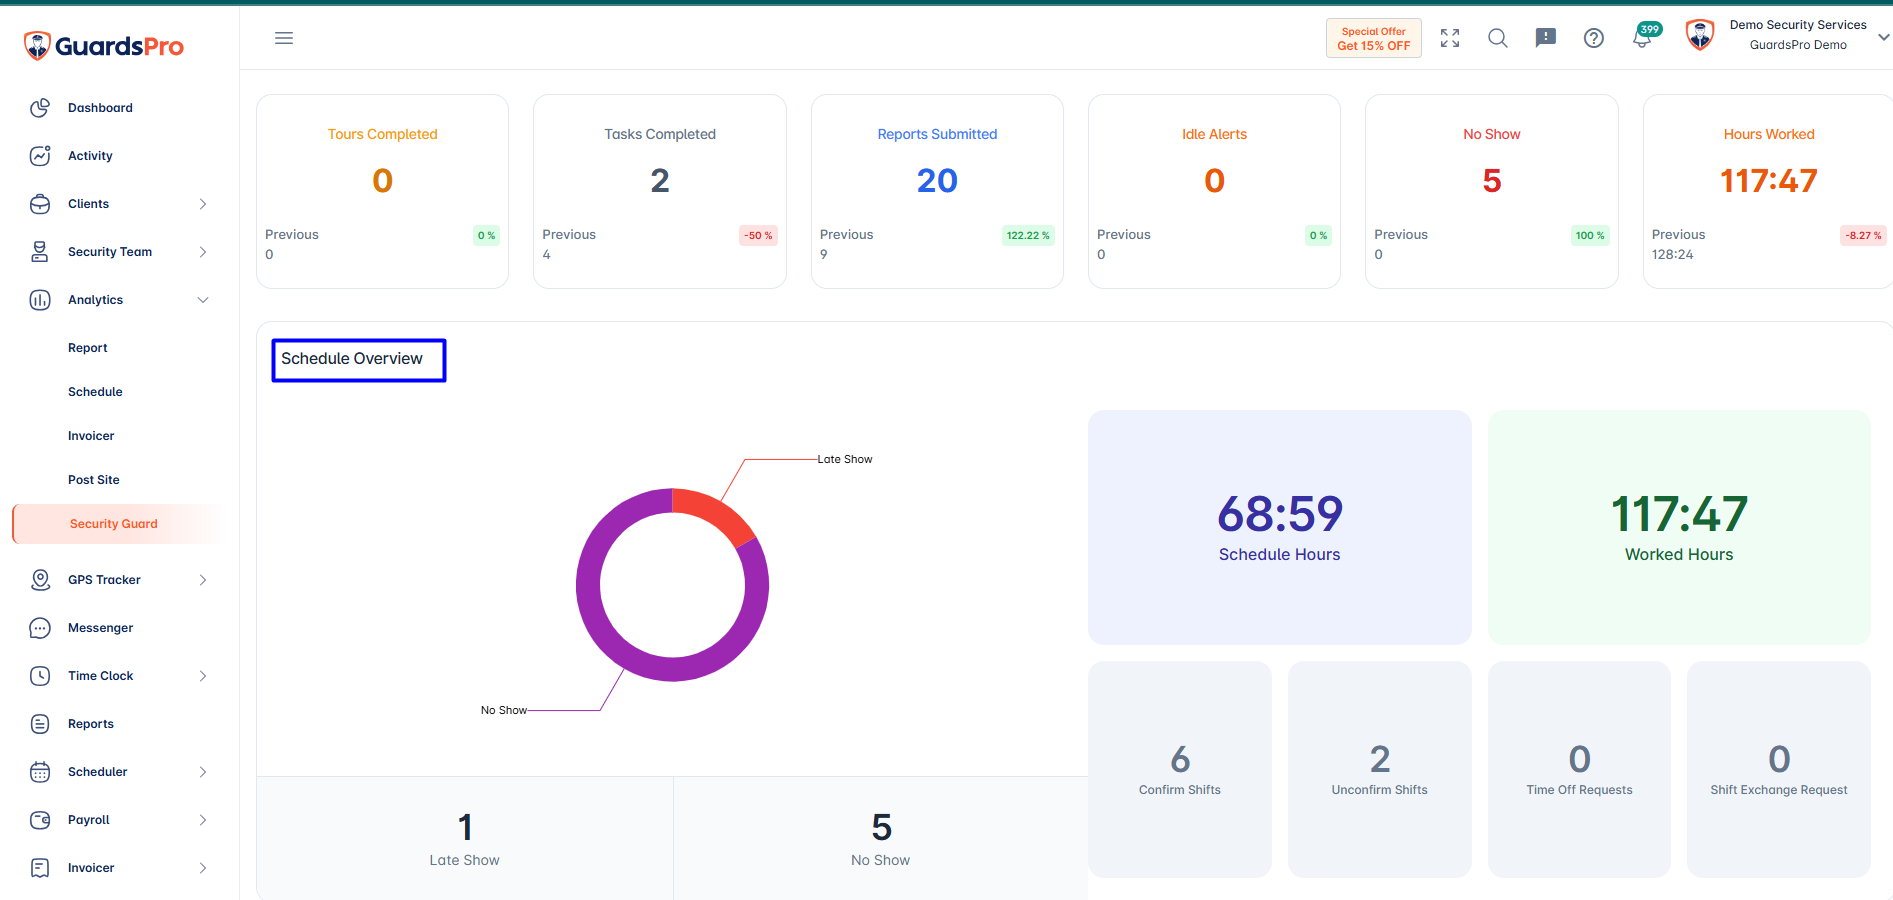
On this screen, you'll be able to review essential information—including tours completed, tasks completed, reports submitted, idle alerts, no-shows, and hours worked.
Next, use the date range filter to choose the period you want to analyze (e.g., Today, Yesterday, Last 7 Days, Last Month, etc.).
The Compare With option allows you to compare the selected timeframe with the corresponding previous period or view the data without comparison.
You can further refine the analytics by filtering data based on:
Client
Post site associated with the client
Additionally, the Save Filters feature allows you to save filter preferences and quickly access previously filtered views.
At the top of the Analytic dashboard, based on the specific client and post site filter several key titles summarize :
Tours Completed: Shows the number of tours completed during the selected period, along with the previous period’s count and percentage change.
Tasks Completed: Displays the number of tasks completed and highlights performance trends through comparison data.
Reports Submitted: Indicates the total reports submitted, including a comparison with the previous period.
Idle Alerts: Shows the number of idle alerts triggered during the selected timeframe. A zero value indicates no idle behavior was detected.
No Shows: Lists the number of shifts missed by guards, with comparative insights.
Hours Worked: Shows the total hours logged by guards and the increase or decrease compared to the previous cycle.
The dashboard also includes four visual widgets for deeper insights:
Schedule Overview
This widget presents a visual summary of attendance performance, including total scheduled hours.
The color-coded donut chart highlights: Late Shows and No Shows
Below the chart, numerical totals provide a clear summary of both metrics.
Incident Overview
The Incident Overview section displays a visual summary of all incidents reported on the selected post site within the chosen timeframe. This chart helps identify trends by showing whether incidents have increased, decreased, or remained consistent over time.
The bar graph displays :
Daily incident counts
Color-coded categories of incidents
A clear date timeline (e.g., Mar 01–Mar 31)
This visual representation allows managers to easily monitor incident patterns, identify irregularities, and take necessary actions to enhance site safety and performance.
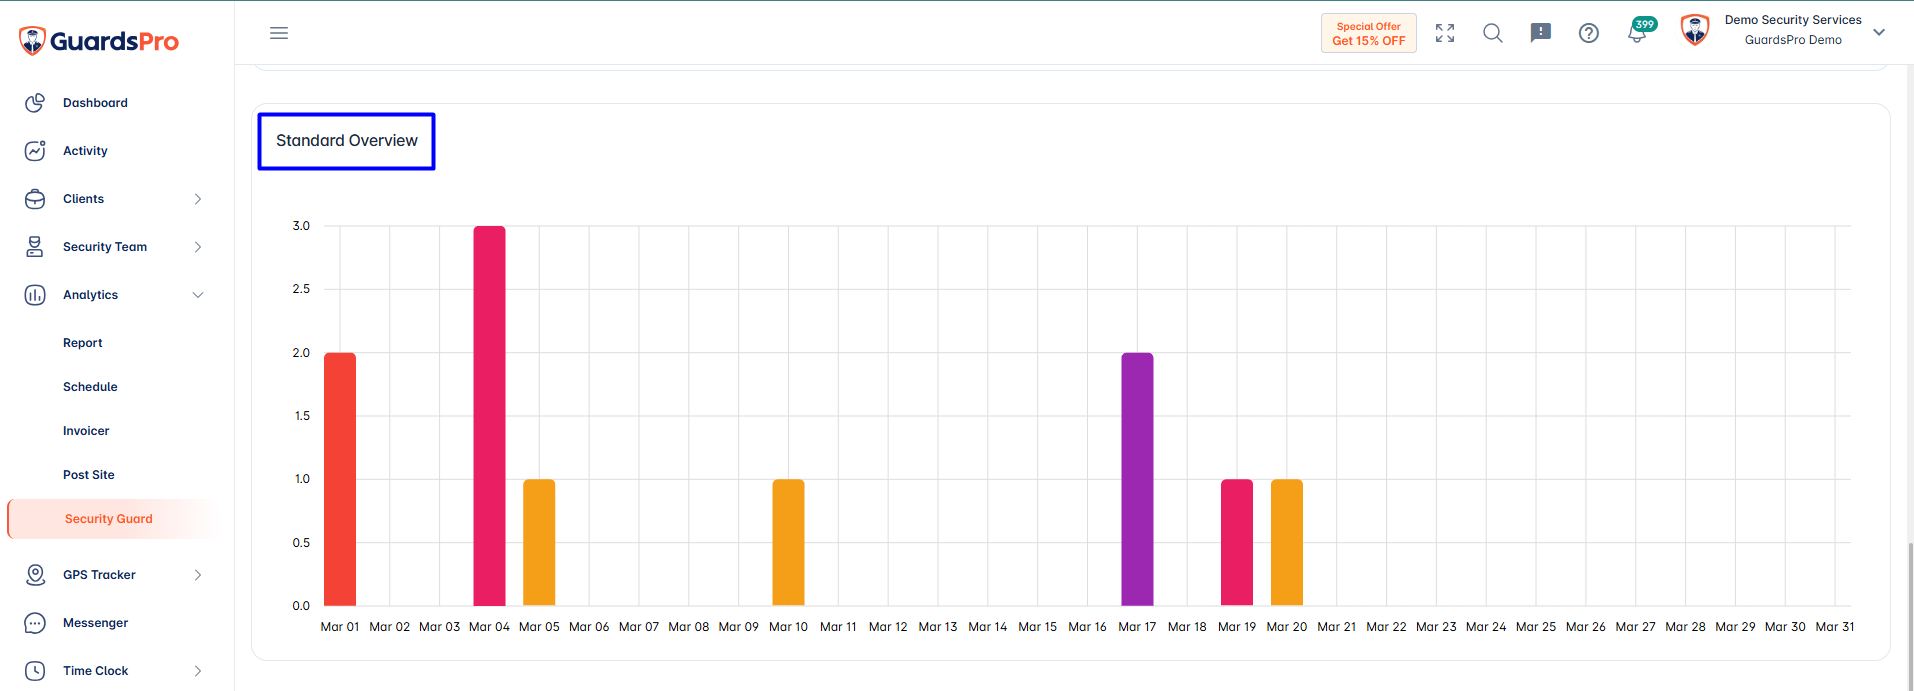
Standard Overview :
The Standard Overview section provides a visual representation of how the number of standard reports has increased or decreased over the selected time period. This chart helps you quickly identify reporting trends and monitor activity across your post sites.
Site Tour Overview
The Site Tour Overview section provides a visual representation of the total number of site tours conducted during the selected period.
This helps you easily track site tour activity and identify any shifts or patterns in guard performance.
By using the available filters, date ranges, and comparison tools, you can efficiently analyze post-site performance and monitor guard activities over time.
If you have any additional questions or need further assistance, please feel free to contact our support team anytime.
For a quick walkthrough, please watch our tutorial video on YouTube here :
Comments
0 comments
Please sign in to leave a comment.